/ Investor Relations & Media / Financial information
Financial
Information
Financial Results
Financial HighlightsDownload
Five-Year Financial Summary - Result in $'000
2025
2024
2023
2022
2021
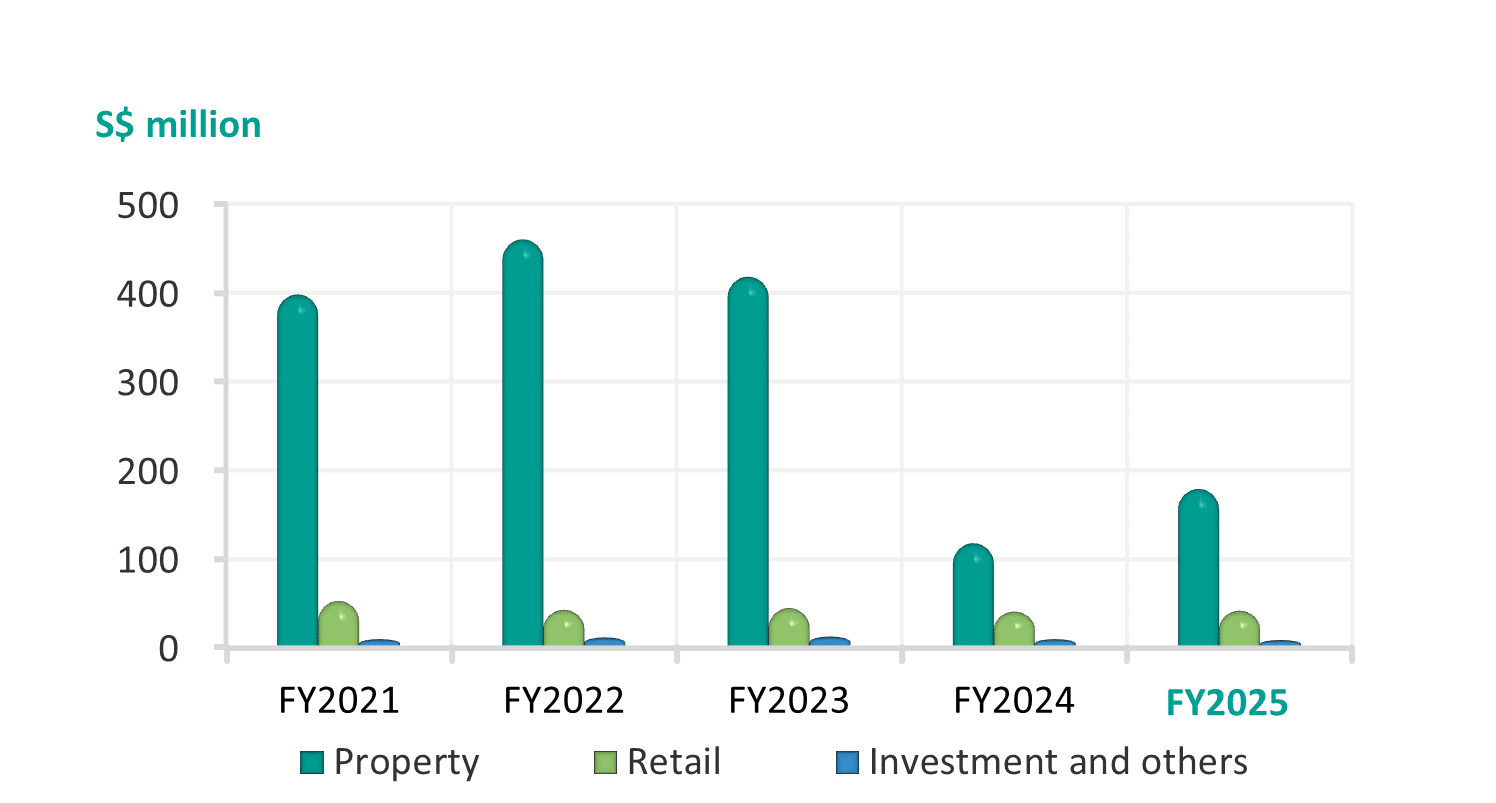
Revenue
230,206
169,172
476,272
514,585
461,396
Property
178,527
117,904
418,516
459,392
398,061
Retail
42,324
40,785
45,199
42,806
53,028
Investment and others
9,355
10,483
12,557
12,387
10,307
Earnings before interest and tax
(25,785)
(52,322)
8,742
171,698
103,222
(Loss)/profit before income tax
(59,473)
(70,929)
(10,741)
149,147
75,255
Total (loss)/profit
(65,937)
(82,233)
11,346
143,682
41,952
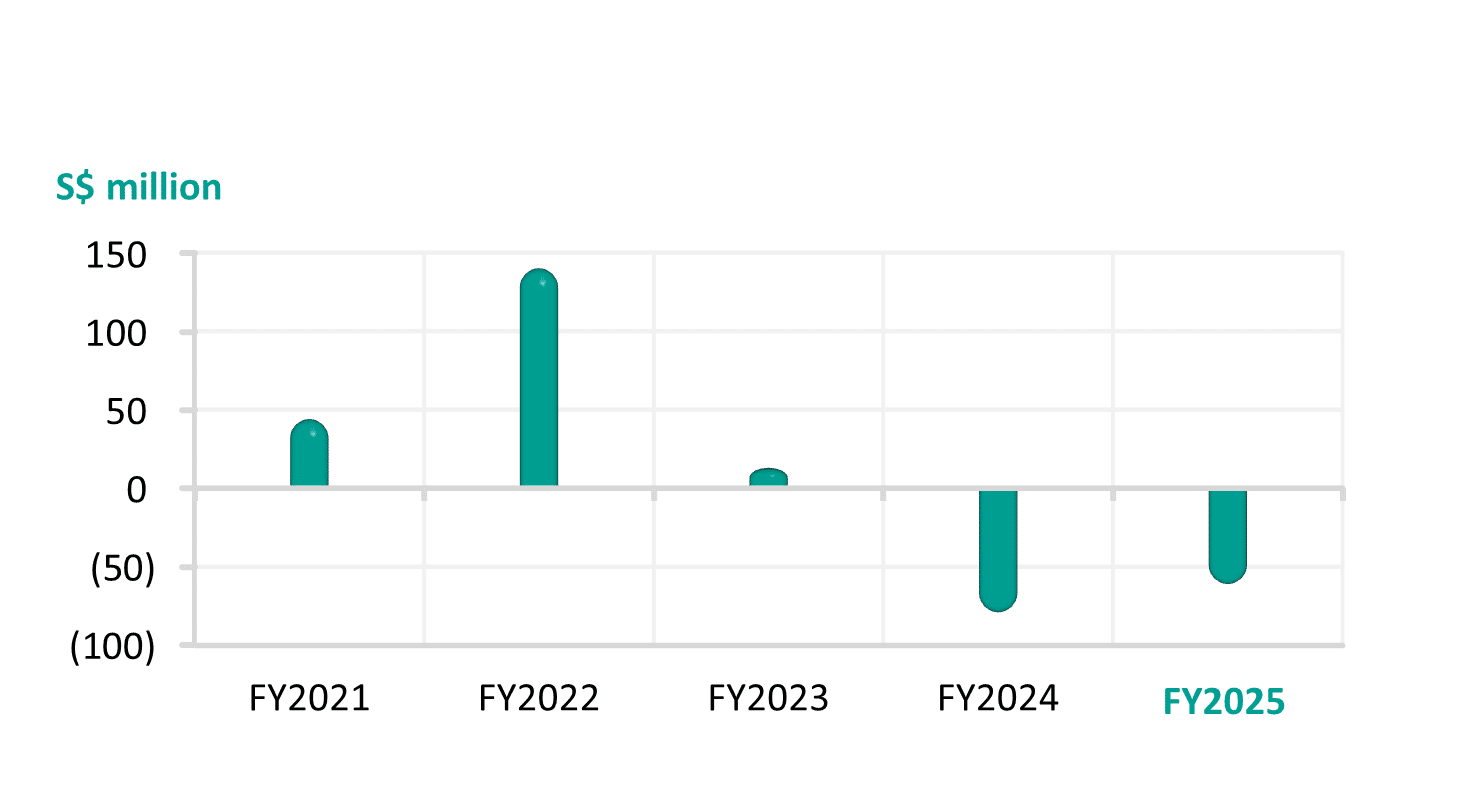
(Loss)/profit attributable to equity holders of the Company
(60,997)
(78,685)
13,307
140,165
43,568
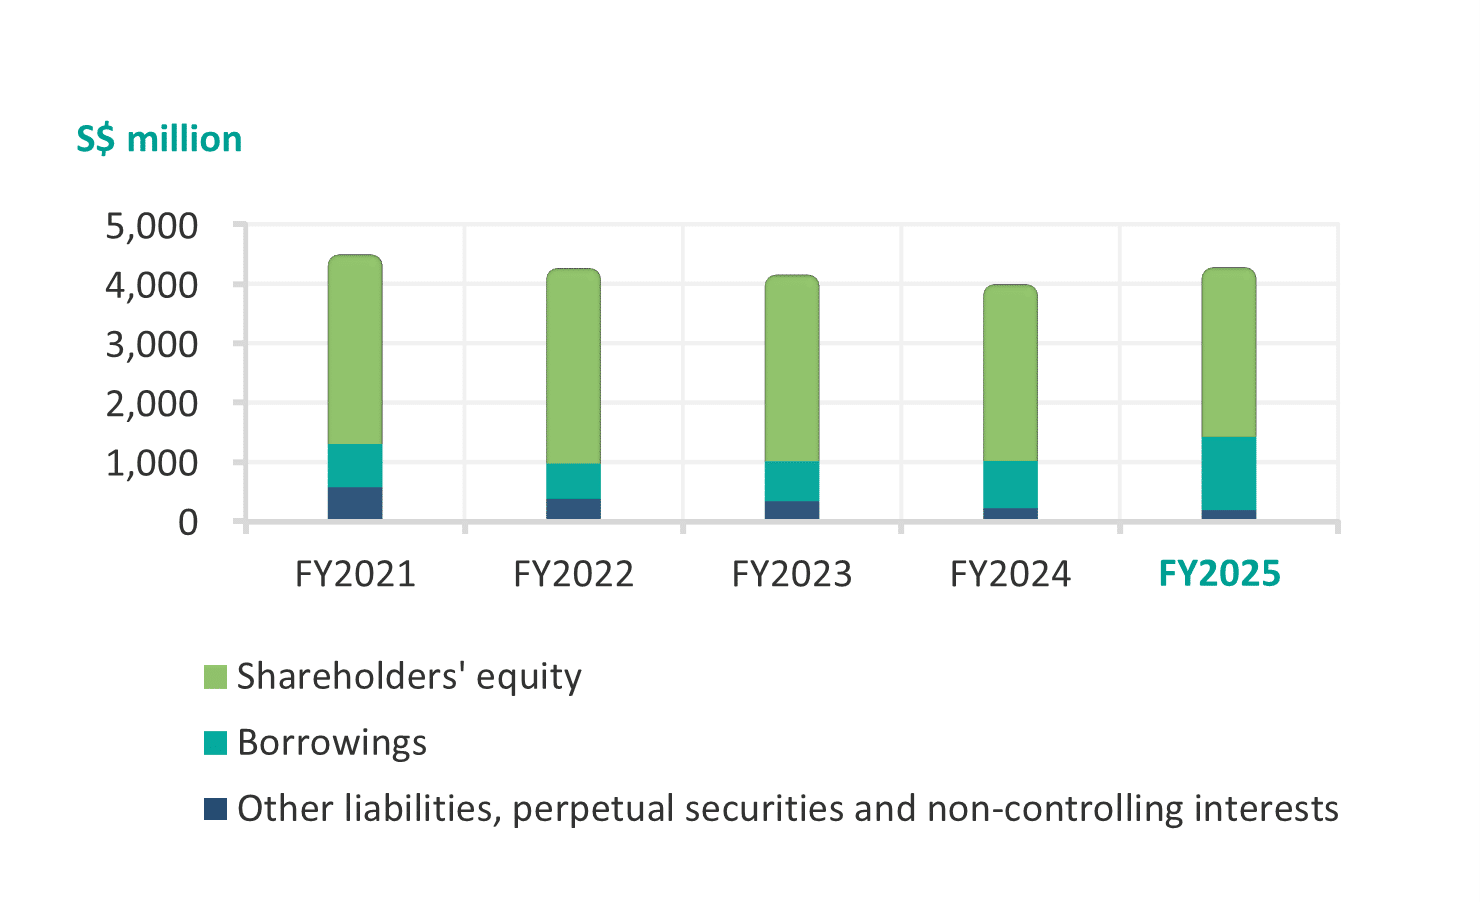
Equity attributable to ordinary shareholders of the Company
2,847,730
2,967,997
3,137,839
3,286,313
3,186,714
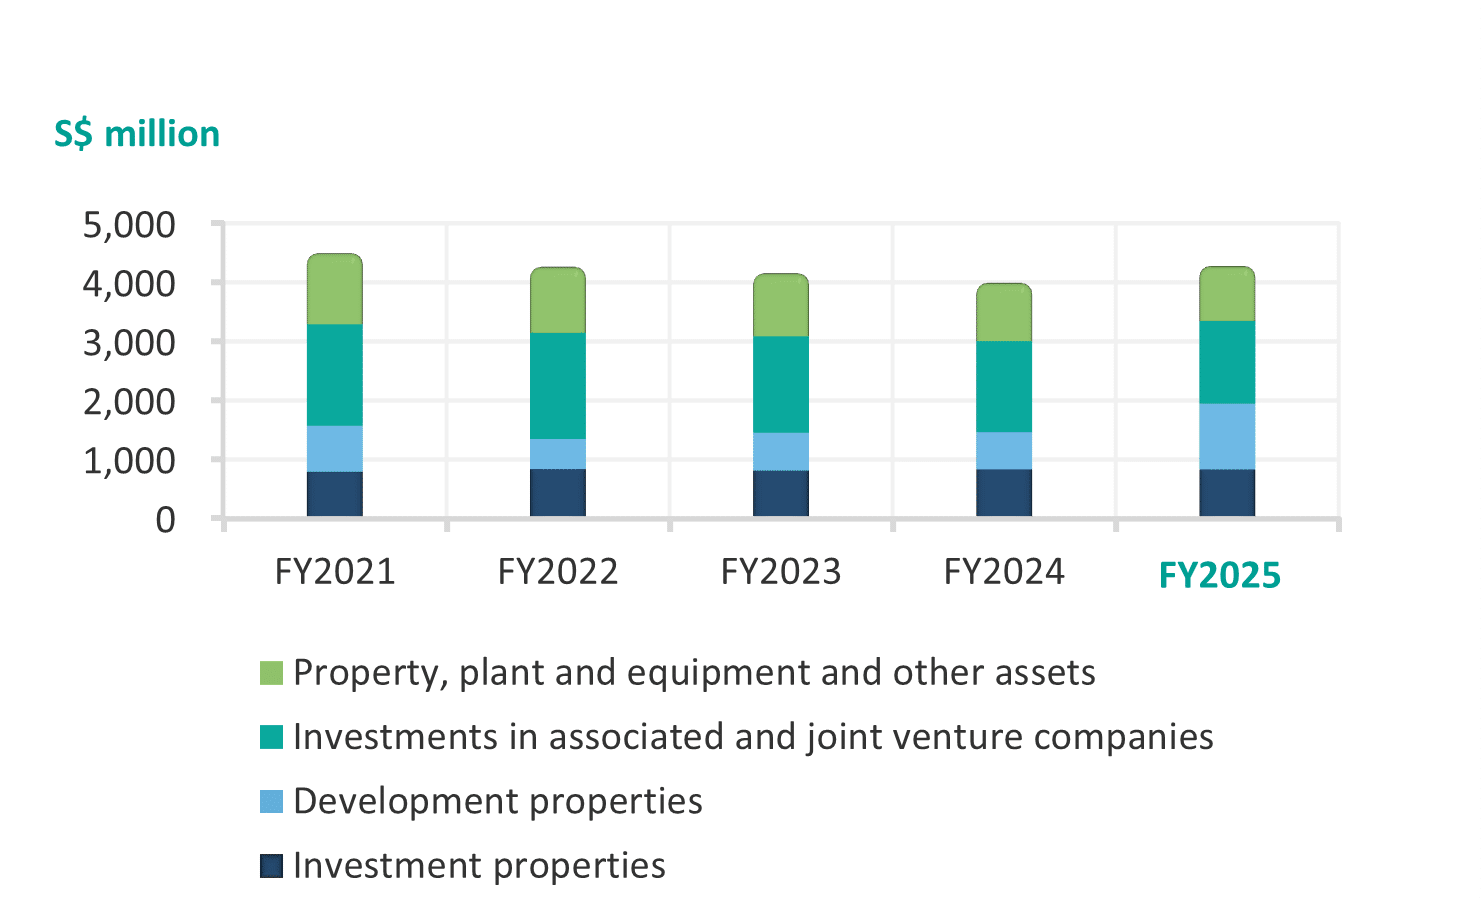
Total assets
4,275,552
3,989,505
4,151,922
4,261,936
4,492,232
Total liabilities, perpetual securities and non- controlling interests
1,427,822
1,021,508
1,014,083
975,623
1,305,518
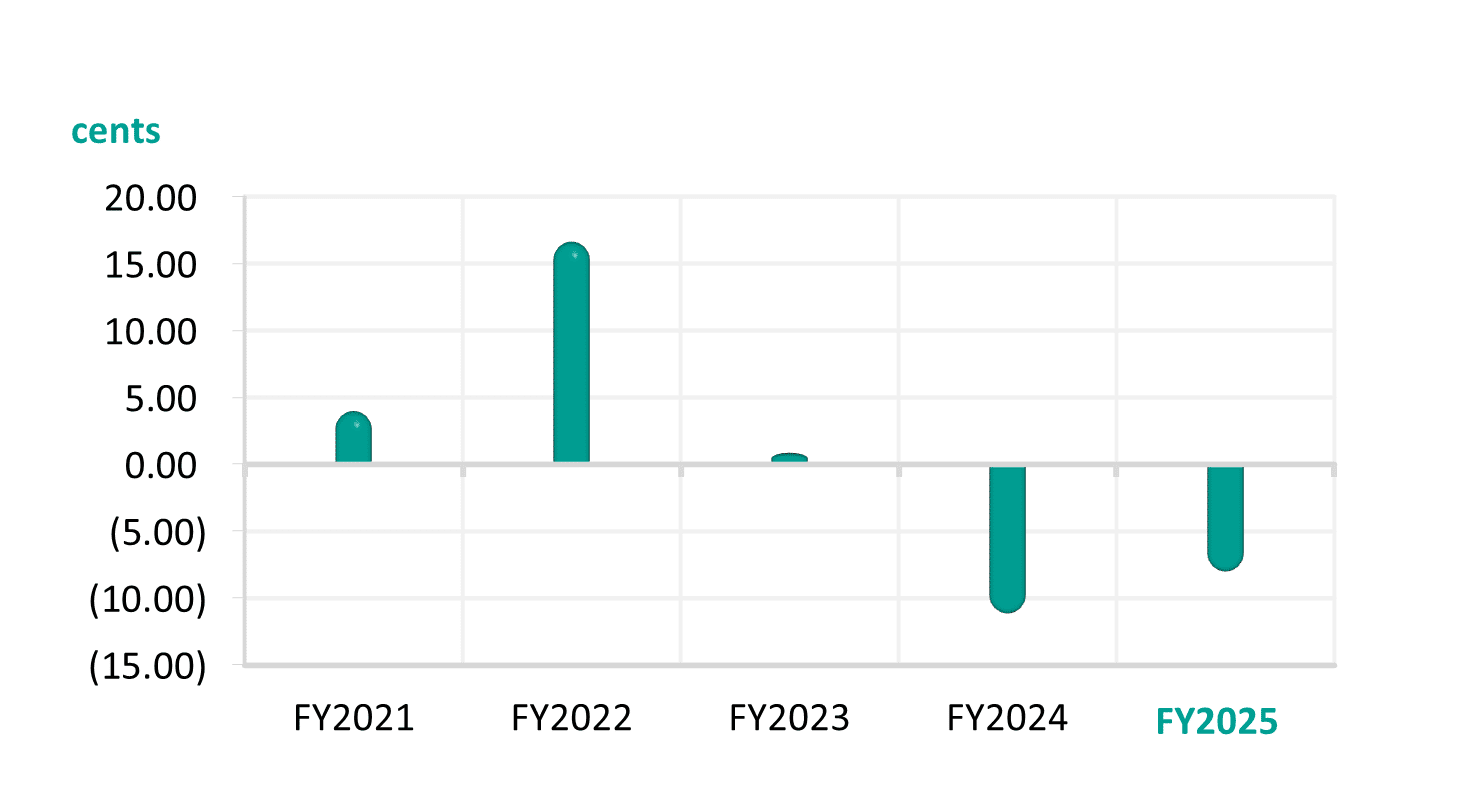
(Loss)/earnings per share1 (cents)
(8.00)
(11.13)
0.87
16.64
3.99
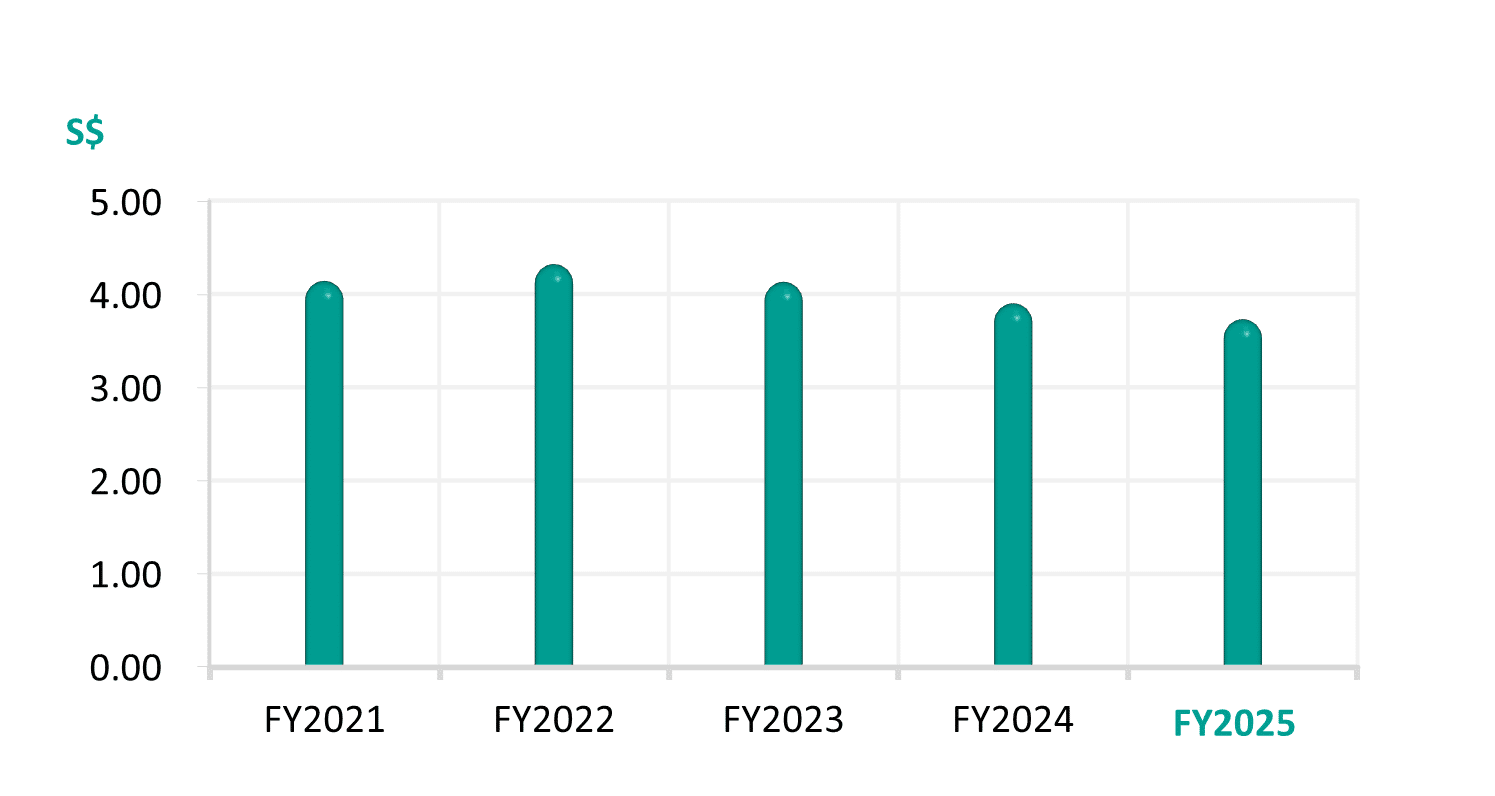
Net tangible assets per share1 ($)
3.73
3.90
4.13
4.32
4.14
Cash dividends per share (cents)
3.00
3.00
5.00
6.00
5.00
Note:
1. The weighted average number of ordinary shares used for this purpose is as follows:
1. The weighted average number of ordinary shares used for this purpose is as follows:
762,572
761,124
760,185
765,274
770,108
Financial Charts & Graphs Download
Five-Year Financial Summary
Revenue
Financial Performance
(Loss)/profit attributable to equity holders of the Company
Source of Funds
Total Assets
(Loss)/Earnings per share
Net Asset Value Per Share